First Seen
2023-08-15T22:04:33+00:00
simple-description (llama3.2-vision_11b)
The meme is a humorous illustration of a power grid map, with a cartoonish "dude" character stuck in the middle, surrounded by various power lines and connections. The text "The Dude" is written in a bold, playful font above the character, while the caption reads "When you realize the power grid is just like a bunch of dudes trying to get along". The meme pokes fun at the complexity of the power grid, comparing it to a social situation where people are trying to work together, but ultimately failing to get along.
detailed-analysis (gemma3-27b-vision)
Okay, let's break down this chart of utility-scale solar capacity in the top five states (2015-2022) through various theoretical lenses. I'll include the headings you requested, but only where the concepts genuinely apply. Some of these lenses simply aren't a good fit for interpreting a quantitative chart like this.
1. Visual Description
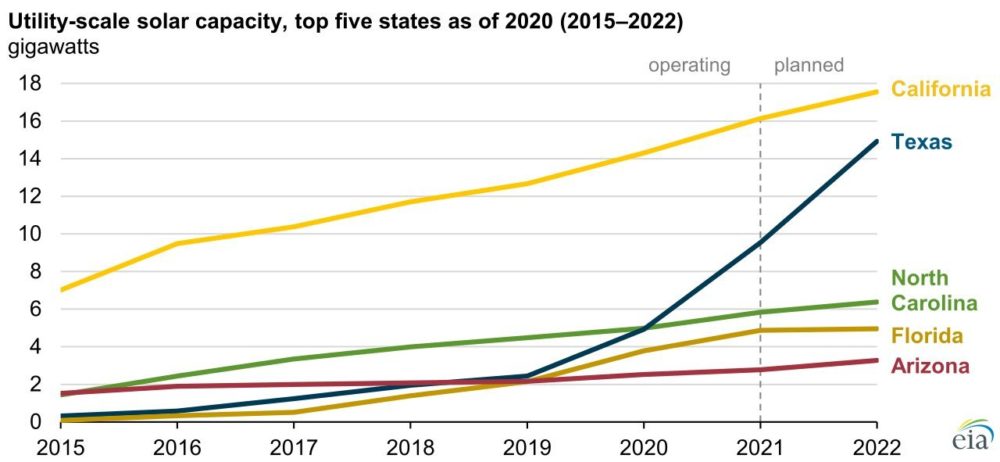
The image is a line graph charting the growth of utility-scale solar capacity in gigawatts for the five states with the highest capacity: California, Texas, North Carolina, Florida, and Arizona. The x-axis represents years from 2015 to 2022. The y-axis measures capacity in gigawatts. Each state is represented by a colored line: California (yellow), Texas (blue), North Carolina (green), Florida (orange), and Arizona (red).
- Trends: California consistently leads with the highest capacity and the most significant, steady growth. Texas exhibits a slower, gradual increase until 2021, followed by a dramatic increase in 2022, almost equaling North Carolina. North Carolina shows consistent, moderate growth. Florida and Arizona show relatively slower, steadier growth, remaining at lower levels of capacity. There is a vertical dashed line at 2021 indicating the period of ‘operating’ and ‘planned’ capacity.
- Overall: The graph demonstrates a clear trend of increasing solar capacity in all five states over the period, suggesting a growing investment and adoption of solar energy. The relative positions and rates of growth highlight differences in state-level policies, resources, and priorities.
2. Marxist Conflict Theory
This chart can be interpreted through a Marxist lens by examining the underlying conflicts surrounding energy production and control.
- Capital Accumulation: The growth of solar capacity demonstrates a shift in capital investment away from traditional fossil fuels and towards renewable energy sources. This shift is driven by both economic factors (decreasing costs of solar technology) and political/social pressures. While appearing "green", this still involves capital accumulation by companies involved in the production, installation, and maintenance of solar infrastructure.
- Class Conflict: The transition to solar energy, while potentially beneficial for the environment, can also involve displacement of workers in the fossil fuel industry, creating class conflict. The benefits of this transition may not be equally distributed, with the owners of solar infrastructure accruing the most profit while workers face job insecurity or changing skill requirements.
- Resource Control: Access to land suitable for solar farms (desert areas, open spaces) becomes a point of potential conflict. Who controls this land—private companies, state governments, or communities—will shape the distribution of benefits and risks associated with solar development.
- State Role: The varying growth rates between states indicate different levels of state intervention and support for solar energy. States with more favorable policies (tax incentives, renewable portfolio standards) tend to see faster growth. This underscores the role of the state in shaping economic development and directing capital accumulation.
3. Postmodernism
A postmodern approach highlights the instability of grand narratives and the fragmented nature of reality.
- Deconstruction of "Progress": The chart presents a narrative of "progress" in renewable energy. A postmodern perspective would question this narrative, pointing out that "progress" is a socially constructed concept with inherent biases. Whose definition of progress is being used? What are the unintended consequences of this shift to solar energy?
- Local Narratives: Each state's individual trajectory challenges a universal narrative of renewable energy adoption. The differing rates of growth suggest that local contexts (geography, economics, politics) play a crucial role in shaping energy transitions.
- The Myth of Technological Solutionism: The chart might be interpreted as promoting a technological solution to environmental problems. A postmodern critique would question this approach, arguing that technological fixes often ignore deeper social and political issues. The growth of solar capacity does not inherently address issues of social justice or economic inequality.
Important Considerations:
- Limited Scope: This chart only focuses on utility-scale solar capacity. It doesn't include rooftop solar, community solar, or other distributed generation sources.
- Data Interpretation: While the chart presents data, the interpretation of that data is always subjective. Different analysts might draw different conclusions.
I hope this breakdown is helpful. Let me know if you’d like me to expand on any specific point or explore a different theoretical perspective.
simple-description (llama3.2-vision)
The meme is a graph showing the top five states with the largest solar power capacity in 2015 and 2019. The graph shows a significant increase in solar power capacity in all five states, with California and Texas leading the others. The text at the top of the image reads, "Utility-scale solar capacity, top 5 states, 2015-2019."
tesseract-ocr
Utility-scale solar capacity, top five states as of 2020 (2015-2022) gigawatts operating planned 18 ' California 16 . 44 Texas 12 1 10 , 8 North 6 ! Carolina 4 7 Florida - Arizona 2 0 a 2015 2016 2017 2018 2019 2020 2021 2022 ela