First Seen
2024-06-04T20:01:16.153416+00:00
simple-description (llama3.2-vision_11b)
The meme is a map of the United States with each state colored according to its average number of hours of sunshine per year. The darker the color, the more sunshine a state receives. The text at the top of the map reads "Sunshine states" and the bottom says "We're not bitter". This meme is poking fun at states that have a lot of sunshine, implying that they are happy with their sunny weather, but also jokingly suggesting that they are not bitter about it.
detailed-analysis (gemma3-27b-vision)
Okay, let's break down this map of US energy consumption per capita using the lenses you've requested. Given the nature of the data, some lenses will be more robust/applicable than others.
Visual Description
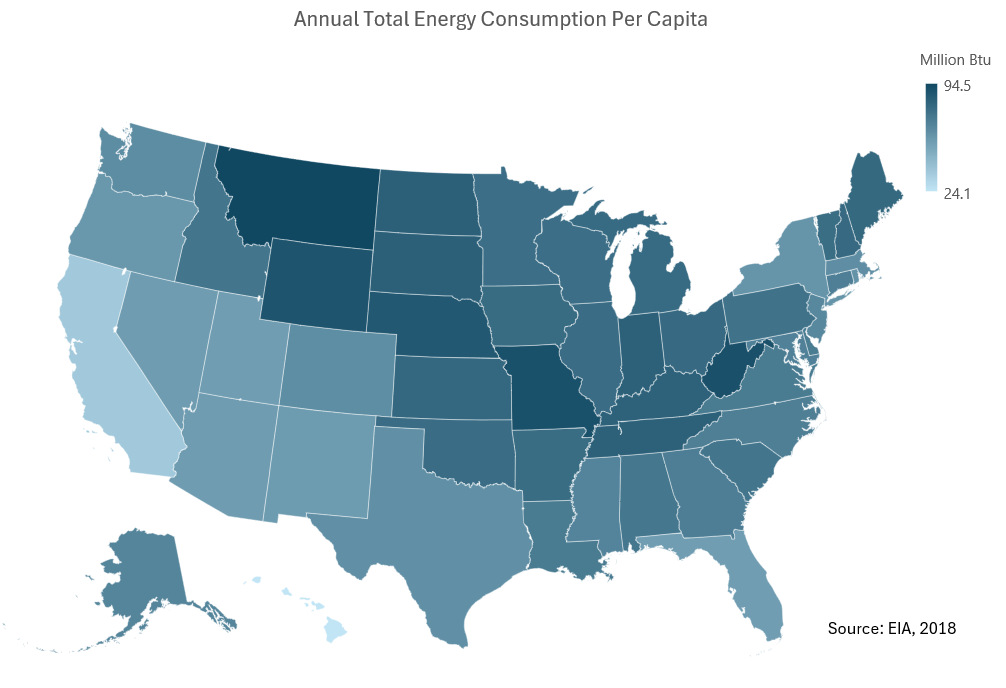
The image is a choropleth map of the contiguous United States displaying annual total energy consumption per capita in millions of British thermal units (Btu). The map uses a gradient scale, transitioning from a very light blue for the lowest consumption levels to a dark blue for the highest.
Key observations:
- Regional Patterns: The map clearly indicates significant regional disparities. The upper Midwest and Northeast consistently show the highest energy consumption (darkest blues). The Southwest and parts of the Southeast exhibit the lowest levels (lightest blues).
- Geographic Clusters: High consumption areas appear clustered around the Great Lakes, the industrial belt of the northeast, and parts of the upper plains.
- Scale: The color scale runs from 24.1 million Btu to 94.5 million Btu, indicating a considerable range in individual energy use across the country.
- Data Source/Date: The bottom right corner indicates the data source as the EIA (Energy Information Administration) from 2018.
Foucauldian Genealogical Discourse Analysis
This map isn’t simply a representation of energy usage; it’s a production of knowledge about energy, citizens, and their practices. A Foucauldian analysis would focus on how this map creates the concept of "energy consumption per capita" as a meaningful category and how this category is used to govern or exert power.
- Discourse & Power: The map participates in a discourse surrounding energy efficiency, environmental responsibility, and regional economic development. By quantifying energy use and presenting it geographically, it constructs a "truth" about which regions are "good" (low consumption) and "bad" (high consumption). This categorization allows for targeted policy interventions (e.g., incentives for energy-efficient building in high-consumption states, or regulations in areas seen as wasteful).
- Normalization: The map establishes a norm for energy usage. Regions falling significantly outside the typical range are flagged, even though the "acceptable" range is inherently constructed through data aggregation and interpretation.
- Genealogy of the Category: A genealogical study would trace the historical emergence of "energy consumption per capita" as a metric. When did this become a key measurement? Who started collecting this data, and what were their motivations? What earlier ways of understanding energy use were displaced by this quantitative metric?
- Discipline and Surveillance: The map can be understood as a form of disciplinary power. By making energy use visible, it allows for the surveillance of regions and potentially individuals, enabling interventions and shaping behavior.
Critical Theory (specifically concerning the “Culture Industry” and Instrumental Reason)
A critical theory lens, drawing from figures like Horkheimer and Adorno, would examine how this map participates in a system of instrumental reason and the creation of a "culture industry" around energy.
- Instrumental Reason: The map's reliance on quantitative data (millions of Btu) exemplifies instrumental reason – the prioritization of efficiency, calculation, and control over qualitative understanding or ethical considerations. It reduces complex human practices (heating, cooling, transportation) to a single numerical value, stripping away context and meaning.
- Commodification of Energy: The map implicitly treats energy as a commodity, quantifiable and comparable across regions. This aligns with the broader commodification of nature and human needs under capitalism.
- False Consciousness: The map might contribute to a false consciousness by presenting a simplified view of energy usage. It obscures the underlying social, economic, and historical factors that shape consumption patterns (e.g., access to public transport, the prevalence of single-family homes, industrial activity, wealth distribution).
- The Role of Information: The map itself is a product of the "culture industry" - the standardization and mass production of information. It presents a seemingly objective view of reality, but its framing and the data it presents are shaped by specific interests and ideologies.
Marxist Conflict Theory
A Marxist analysis would focus on the relationship between energy consumption patterns and class relations/economic structures.
- Uneven Development: The map illustrates uneven development across the United States. Higher energy consumption in the Northeast and Midwest may reflect the concentration of industry, manufacturing, and a larger, wealthier population capable of affording higher energy use. Lower consumption in the South and Southwest may be linked to lower income levels, different housing types, and a less industrialized economy.
- Resource Control & Exploitation: This map can be linked to broader patterns of resource control and exploitation. The energy consumed in these regions is often produced through the extraction of fossil fuels (coal, oil, natural gas), potentially at the expense of marginalized communities in extraction zones.
- Capital Accumulation: High energy consumption is often linked to economic activity and capital accumulation. The industrial areas with high energy usage are likely the sites of significant wealth creation.
- Class-Based Energy Access: Different classes have different patterns of energy access and usage. Wealthier households can afford larger homes, more appliances, and more travel, leading to higher energy consumption.
- Imperialism and Neocolonialism: The map implicitly highlights how energy consumption patterns in the US are linked to global resource extraction and consumption. High levels of energy usage in the US contribute to global environmental problems and exacerbate inequalities in other parts of the world.
Postmodernism
A postmodern lens would emphasize the instability of meaning and the constructed nature of this map.
- Deconstruction of "Objective" Data: Postmodernism would challenge the notion that the map presents an “objective” representation of reality. The data is not neutral; it's been collected, categorized, and visualized through specific choices, potentially obscuring other important aspects of energy use.
- Fragmentation & Local Narratives: Postmodernism would focus on the diverse local narratives obscured by the map’s generalization. What are the specific reasons for high energy consumption in the Northeast? What are the unique cultural and economic factors in the Southwest?
- Rejection of Grand Narratives: Postmodernism would be skeptical of any “grand narrative” about energy and progress. The map may imply that higher energy consumption is linked to economic development, but this is just one possible interpretation.
- Simulacra & Hyperreality: The map itself can be seen as a simulacrum – a copy without an original. It is a representation of representation, creating a “hyperreality” where the map becomes more important than the actual energy consumption it depicts.
Queer Feminist Intersectional Analysis
This lens is less directly applicable to the map’s surface features, but still provides insightful connections:
- Gendered Energy Consumption: Energy consumption is often gendered. Historically, women have been primarily responsible for household energy management. Examining how gender roles and expectations influence energy usage within the home is a crucial intersectional consideration.
- Spatial Justice & Vulnerability: Mapping energy consumption can reveal spatial inequalities in access to affordable and reliable energy. Marginalized communities (particularly low-income communities of color) are often disproportionately burdened by high energy costs and inadequate energy infrastructure. This intersects with issues of environmental racism and spatial justice.
- Intersectional Vulnerability: Energy poverty disproportionately affects women, particularly those who are single mothers or elderly, creating an intersectional vulnerability.
- Queer Approaches to Resource Use: The map's emphasis on maximizing energy efficiency aligns with queer feminist principles of valuing care, sustainability, and collective well-being. It prompts questions about how we can move away from extractive, exploitative systems of resource use towards more equitable and regenerative models.
I hope this breakdown provides a comprehensive analysis of the map using the requested theoretical lenses. Let me know if you'd like me to elaborate on any specific point or apply additional frameworks.
tesseract-ocr
Annual Total Energy Consumption Per Capita Million Btu I 945 ‘ares TN , 4 244 J ‘ it = s - = i i _ en) 4 7 q | ee ] — dm a i eal = \ | gn i / | - { ou of a | a iz | | fe nm i = " | i ae er } Y z y | } | } —_—_ - | | };--R . Nee t > | { eon A & % Source: EIA, 2018
simple-description (llama3.2-vision)
The meme is a map of the United States, where each state is colored based on its average number of days with temperatures above 90°F (32°C) during the summer. The text "Summer" is written above the map, and the states with the most days above 90°F are highlighted in a darker shade.