First Seen
2025-04-22T15:26:44.613110+00:00
detailed-analysis (gemma3_27b-it-q8_0)
Okay, let's analyze this chart – a Freddie Mac Serious Delinquency Rate chart – through the lens of "Collapse," leaning on applicable theoretical frameworks. Given the context, this isn't a "meme" in the traditional humorous sense, but a data visualization that resonates with the anxieties and discourse surrounding systemic collapse.
Visual Description
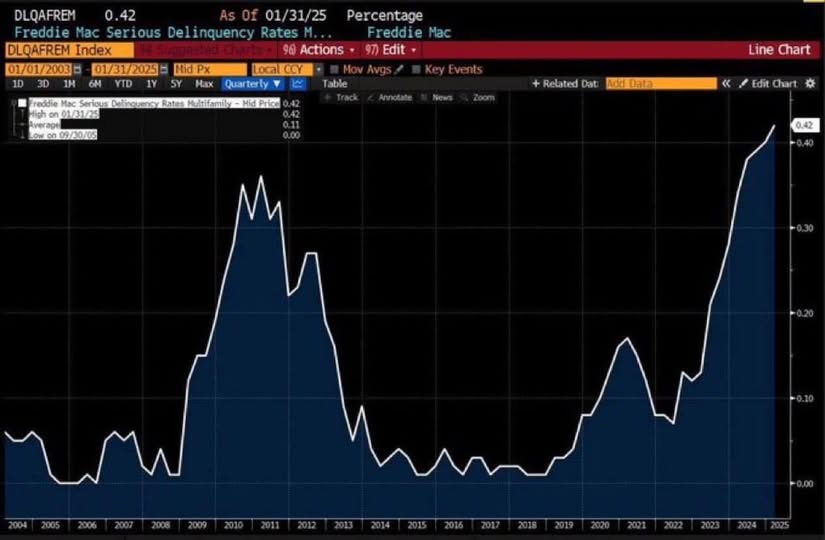
The image presents a line graph tracking the “Serious Delinquency Rate – Multifamily” from Freddie Mac. The x-axis represents time (years from 2004 to January 2025). The y-axis indicates the percentage of seriously delinquent mortgages. The line itself is strikingly significant. It's relatively stable, undulating at a low level from 2004-2006. It then experiences a dramatic, sharp spike around 2008-2010, coinciding with the Global Financial Crisis. After a period of decline, it remains fairly subdued until 2020. Since 2023, the line has begun to climb again, with a very steep ascent in late 2023 and early 2024, ending at 0.42% – significantly higher than anything seen post-2010. The visual impression is one of a system that was disrupted, appeared to recover, but is now facing a renewed, potentially more serious destabilization. The color scheme (dark background, bright lines) accentuates the volatility.
Foucauldian Genealogical Discourse Analysis
Michel Foucault’s work on power, knowledge, and discourse is highly relevant. The chart isn't a neutral depiction of "reality." It's a production of reality through specific regimes of knowledge. Here’s how:
- Discourse of Financial Stability: For decades, a discourse of increasing financial stability, efficient markets, and responsible lending was constructed (and continues to be challenged). This chart illustrates a rupture in that discourse. The initial spike in 2008 exposed the fragility beneath the surface.
- Delinquency as a Marker: "Serious Delinquency" isn't a natural category. It’s a financial construct—a way of categorizing and quantifying risk. This categorization creates the problem it seeks to measure. It's a power/knowledge relation: the act of labeling debt as “serious” generates a specific set of consequences and surveillance mechanisms.
- The Genealogy of Risk: A genealogical approach would trace the historical emergence of risk assessment and the technologies of financial control. The chart demonstrates the ongoing struggle between attempts to manage risk and the inevitable recurrence of instability. The recent spike suggests a failure, or at least a questioning, of those control mechanisms.
- Governmentality: The data is generated and presented by Freddie Mac, a government-sponsored enterprise. This demonstrates how the state (through its agencies) attempts to govern economic behavior through data collection, regulation, and market interventions. This chart demonstrates the limitations of that governance.
Critical Theory
Drawing on the Frankfurt School, we can see the chart as symptomatic of deeper societal problems:
- Instrumental Reason: The relentless pursuit of profit and efficiency within the financial system, driven by "instrumental reason" (reason solely focused on achieving pre-defined goals), has led to increasingly complex and fragile systems. This chart reveals the inherent instability of that logic.
- Commodification: The reduction of housing – a fundamental human need – to a commodity subject to market forces is a key problem. Delinquency rates, therefore, represent a failure of this system to provide basic security.
- Ideology: The narrative of a free market and individual responsibility often obscures the structural factors that contribute to financial distress. The chart doesn’t tell us the underlying causes, but it demands we question the ideological underpinnings of the system.
- Reification: The data presented in the chart can be seen as reification – the treatment of abstract concepts (like delinquency rates) as concrete, objective realities, obscuring the human consequences and social forces at play.
Marxist Conflict Theory
A Marxist lens highlights the class struggles embedded within the data:
- Capital Accumulation: The financial system exists to facilitate capital accumulation by the ruling class. The mortgage-backed securities that underpin this system are a means of extracting profit from the labor of others.
- Exploitation: The delinquency rates represent the consequences of exploitative lending practices and wage stagnation, particularly for working-class and marginalized communities.
- Contradictions of Capitalism: The chart illustrates the inherent contradictions of capitalism – the tendency toward overproduction, crises of profitability, and the concentration of wealth. The spike in delinquencies is a symptom of these contradictions.
- Class Warfare: The current spike in delinquencies could be interpreted as a consequence of systemic inequalities, where working-class families are disproportionately affected by economic downturns and predatory lending practices.
Postmodernism
Postmodern thought complicates the interpretation, questioning the very notion of a single, coherent narrative of "collapse."
- Meta-Narratives: The idea of a linear progression towards economic progress – a central "meta-narrative" of modernity – is undermined by the chart. It shows cycles of boom and bust, disruption and temporary recovery.
- Simulacra & Simulation: The financial system, and the data that represents it, can be seen as a simulation of economic reality. The delinquency rates are a representation of a representation, increasingly detached from any underlying substance.
- Deconstruction: The chart can be "deconstructed" to reveal the hidden assumptions and power dynamics that shape its meaning. For instance, what constitutes a "serious delinquency" is a socially constructed category.
- Fragmentation: The volatility of the line chart mirrors the fragmentation of contemporary experience.
In conclusion, this chart isn't just a piece of economic data. It's a powerful visual representation of systemic instability, reflecting anxieties about the potential for widespread collapse. The various theoretical frameworks offer different, but complementary, ways of understanding the chart's significance. It prompts a critical examination of the power structures, ideological assumptions, and underlying contradictions that shape our economic realities. The dramatic recent rise is a particularly unsettling signal, evoking fears of a renewed and potentially more severe crisis.
simple-description (llama3.2-vision_11b)
The meme is a screenshot of a financial news website, specifically a chart showing the collapse of the FTX cryptocurrency exchange. The chart shows a sharp decline in the value of FTX's token, FTT, from around $80 to almost $0 in a matter of days. The text "FTX: $0.00" is displayed at the top of the chart, indicating the collapse of the exchange's token.
detailed-analysis (gemma3-27b-vision)
Okay, let's break down this chart of Freddie Mac's Serious Delinquency Rates, approaching it through a series of theoretical lenses as requested.
Visual Description
The chart displays a line graph tracking Freddie Mac's serious delinquency rates (as a percentage) from January 2004 to January 2025. The y-axis ranges from 0.00 to 0.42, representing the percentage of loans considered seriously delinquent. The x-axis displays time in years.
Key observations:
- Initial Stability (2004-2006): The rate begins at a relatively low level and remains fairly stable.
- Rapid Rise (2007-2009): A dramatic increase begins around 2007, peaking sharply during the 2008 financial crisis.
- Post-Crisis Decline (2010-2019): The delinquency rate falls significantly from its peak, reaching a relatively low point around 2019.
- COVID-19 Spike (2020): A sharp, but less dramatic, spike occurs in 2020, likely coinciding with the economic fallout of the COVID-19 pandemic.
- Recent Increase (2023-2025): The rate begins to climb again in 2023, accelerating sharply into 2025, suggesting a new wave of financial strain.
- Volatility: The chart exhibits significant volatility throughout the period, particularly around major economic events.
Foucauldian Genealogical Discourse Analysis
This chart, viewed through a Foucauldian lens, is not simply a representation of economic reality, but a production of it. It's a document within the "discourse" of finance, housing, and risk assessment. Here's how:
- Power/Knowledge: The very definition of "serious delinquency" is a power/knowledge construct. Who decides what constitutes a serious delinquency, and what criteria are used? This categorization creates the problem it claims to describe. The graph doesn’t neutrally reflect delinquency; it performs it by labeling and quantifying it.
- Genealogy of Risk: Tracing the history of this data point (serious delinquency rates) reveals shifts in how risk is understood and managed. Before 2008, the discourse prioritized expanding homeownership, often with lax lending standards. The 2008 crisis re-calibrated the discourse, placing more emphasis on risk aversion. The post-2008 decline shows the implementation of new regulatory mechanisms. The current rise suggests a potential resurgence of risk-taking or new forms of vulnerability.
- Disciplinary Power: The chart operates as a tool of disciplinary power. It allows institutions (Freddie Mac, lenders, regulators) to monitor, categorize, and intervene in the behavior of borrowers. The constant surveillance implied by this data contributes to a system of control.
- Normalization: The chart "normalizes" certain levels of delinquency, presenting them as expected fluctuations within the financial system. This can mask underlying systemic issues and prevent radical interventions.
Critical Theory
A critical theory approach would focus on the underlying social and political structures that create the conditions for these delinquency rates.
- Systemic Contradictions: The chart highlights inherent contradictions within the capitalist system. The drive for profit maximization encourages risky lending practices, leading to booms and busts. The pursuit of homeownership for all clashes with the realities of income inequality and wage stagnation.
- Commodification of Housing: Housing is treated as a commodity subject to market forces, rather than a fundamental human right. This leads to speculation, bubbles, and ultimately, foreclosure crises.
- Ideology: The chart is embedded within a broader ideology that justifies the existing economic order. It presents financial instability as an unavoidable consequence of market dynamics, rather than a result of systemic failures.
- Alienation: The chart represents the alienation of individuals from the housing market. Many people are unable to afford decent housing, and are vulnerable to financial hardship.
- Hegemony: The chart subtly reinforces the hegemony of financial institutions and the capitalist system. It presents their data as objective truth, obscuring the power dynamics at play.
Marxist Conflict Theory
From a Marxist perspective, the chart is a reflection of the class struggle inherent in capitalism.
- Exploitation: The rise in delinquency rates is linked to the exploitation of workers, whose wages have stagnated while housing costs have risen. This creates a situation where people are unable to afford their mortgages.
- Capital Accumulation: The chart illustrates the process of capital accumulation by financial institutions. They profit from lending, even when it leads to widespread financial hardship.
- Crisis Tendencies: The cyclical pattern of booms and busts demonstrated by the chart is a manifestation of the inherent crisis tendencies of capitalism.
- Class Polarization: The rise in delinquency rates is likely to disproportionately affect working-class and minority communities, exacerbating existing inequalities.
- The State as Instrument of the Ruling Class: The state's response to the crisis (e.g., bailouts, regulations) is likely to favor the interests of financial institutions over those of ordinary people.
Postmodernism
A postmodern reading of the chart would deconstruct its claims to objective truth.
- Relativism: There's no single, objective definition of "serious delinquency." The criteria used to define it are socially constructed and subject to interpretation.
- Fragmentation: The chart represents a fragmented and chaotic reality, where there are no overarching narratives or grand truths.
- Simulation & Hyperreality: The chart is a simulation of reality, a representation that is removed from the actual lived experiences of those affected by delinquency.
- The Death of the Author: The chart should not be seen as a neutral representation of reality; it is a product of the institutions that created it and their own biases and agendas.
- Rejection of Metanarratives: The chart cannot provide a comprehensive explanation of the housing market or the economic system. Any attempt to do so would be a metanarrative that ignores the complexity and contingency of reality.
Queer Feminist Intersectional Analysis
This lens would examine how power structures related to gender, sexuality, race, class, and other social categories intersect to produce these delinquency rates.
- Disproportionate Impact: The chart likely masks the fact that certain groups (e.g., women, people of color, LGBTQ+ individuals, low-income households) are disproportionately affected by delinquency rates. Historical and ongoing discrimination in lending practices (redlining, discriminatory loan terms) contribute to this.
- Care Work and Economic Vulnerability: Women, who often bear a disproportionate burden of care work, may have limited access to economic resources and be more vulnerable to financial hardship.
- Intersection of Identity and Precarity: LGBTQ+ individuals, especially those from marginalized racial or ethnic backgrounds, may face additional barriers to homeownership and be more susceptible to foreclosure.
- The Gendered Dimension of Housing Insecurity: Women are more likely to experience housing insecurity due to factors such as domestic violence, divorce, and wage inequality.
- Challenging Heteronormative Housing Models: Traditional housing models may not be inclusive of diverse family structures and living arrangements.
Disclaimer: This analysis is based solely on the chart provided and general theoretical frameworks. A more nuanced understanding would require additional data and contextual information. It’s also important to remember that any application of these theories is interpretive and open to debate.
simple-description (llama3.2-vision)
The meme is an image of a financial chart showing a significant price drop in the stock of a company called "FREEDOM" (likely a joke or a play on the concept of freedom). The chart shows a sharp decline in the stock price, with the text "FREEDOM" written in bold letters at the top of the chart. The caption is likely "FREEDOM IS SLIPPING AWAY".