First Seen
2026-02-22T00:03:31+00:00
simple-description (qwen3.5_2b-q8_0)
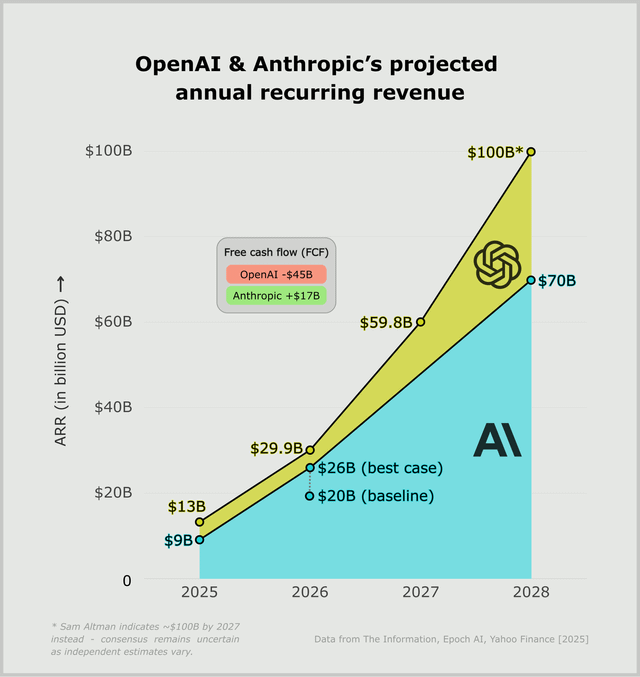
The image portrays OpenAI's ambitious goal to generate $100 billion in Annual Recurring Revenue (ARR) by 2028, a financial target that has been treated as a meme-worthy absolute certainty. The visual humor is highlighted by the asterisk at the top right which notes: "* Sam Altman indicates ~$100B by 2027 instead - consensus remains uncertain as independent estimates vary."
detailed-analysis (gemma3_27b-it-q8_0)
Okay, let's break down this chart—presenting projected Annual Recurring Revenue (ARR) for OpenAI and Anthropic—through a few critical theory lenses, relevant to the context of Artificial Intelligence. Given the visual nature and the themes inherent in AI development, some frameworks will be more applicable than others.
Visual Description
The chart is a line graph depicting projected ARR (in billions of USD) from 2025 to 2028 for OpenAI and Anthropic. OpenAI’s projected revenue is represented by a teal curve, and Anthropic’s by a golden curve. The teal curve starts at $9B in 2025 and rapidly ascends to $20B (baseline), $26B (best case), $59.8B in 2027, and reaches $70B in 2028. Anthropic's curve begins at $13B in 2025 and is projected to reach $29.8B in 2026 and $100B in 2028. A text box highlights Free Cash Flow (FCF) estimates for each company. The overall impression is one of exponential growth, with OpenAI dominating in total revenue, but Anthropic achieving parity by 2028, if their projections hold true. The logos of each company are prominently displayed at the 2028 point, subtly branding the potential outcome. The chart subtly frames these as competitive scenarios, not simply independent growths.
Foucauldian Genealogical Discourse Analysis
This chart isn’t just about revenue; it’s a crystallization of a discourse surrounding AI. A Foucauldian analysis would be very applicable here.
- Power/Knowledge: The chart performs a certain kind of power. By presenting these projections as ‘facts’ (even with caveats at the bottom), it shapes how we understand AI's value, legitimacy, and trajectory. The very act of quantifying AI’s potential translates it into a manageable, investable object. The 'data' cited—from specific sources (The Information, Epoch AI, Yahoo Finance)—lends authority, yet these sources are themselves embedded in power structures.
- Genealogy of the "Intelligent Machine": Tracing the history of how we came to define "intelligence" and then project its economic value is crucial. The idea of a machine capable of generating significant financial return is rooted in centuries of philosophical and scientific developments – from automatons to cybernetics to modern machine learning. The chart represents a contemporary moment in that genealogy, where 'intelligence' is equated with market potential.
- Disciplinary Power: The projected revenues encourage a certain discipline within the AI field. They create incentives for researchers, developers, and investors to adhere to the path of commercialization and scaling. The chart implicitly demands performance against these benchmarks. Those who deviate risk falling behind.
- Normalization: The projection of multi-billion dollar valuations normalizes the idea of AI as a core economic engine. It makes the prospect of AI influencing (or dominating) significant sectors of the economy seem inevitable, and thus, less open to questioning.
Critical Theory (Frankfurt School – Adorno & Horkheimer)
From a critical theory perspective, this chart is a stark representation of the “instrumental reason” that Adorno and Horkheimer critiqued.
- Commodification of Intelligence: The most significant point is the reduction of “intelligence” – a historically and philosophically complex concept – to a quantifiable economic value. It’s being treated as a commodity, subject to market forces, and stripped of any inherent ethical or social value.
- Culture Industry: The presentation of these projections (likely disseminated through media, reports, etc.) participates in the "culture industry," reinforcing the idea that value lies in economic growth and technological advancement above all else. It's a spectacle designed to elicit investment and further perpetuate the cycle.
- Domination of Nature: The pursuit of AI, as represented by the chart's escalating revenues, can be seen as a continuation of the Enlightenment project's drive to dominate nature—in this case, the “natural” intelligence of humans. The chart implicitly suggests that artificial intelligence can surpass human intelligence in economic terms.
- Loss of Autonomy: The emphasis on scaling and revenue maximization may stifle more exploratory or ethically-focused AI research, leading to a loss of autonomy in the field, where innovation is driven primarily by market demands.
Marxist Conflict Theory
This chart, through a Marxist lens, highlights the potential for intensified class conflict and the concentration of capital.
- Means of Production: AI (and the data/computing infrastructure it relies on) constitutes a new "means of production.” OpenAI and Anthropic are positioned as controlling entities within this new means of production.
- Bourgeoisie vs. Proletariat (New Configuration): The immense wealth projected for these companies suggests a further concentration of capital in the hands of a few (the "AI bourgeoisie"). The "proletariat" in this scenario isn’t necessarily factory workers, but those whose labor (data generation, model training, content moderation, etc.) contributes to the creation of value without receiving a commensurate share of the profits. Even professional AI developers might find themselves relatively powerless in the face of these behemoths.
- Exploitation of Labor & Data: The value generated by AI is heavily reliant on unpaid labor – the data contributed by users, often without full awareness or control. This data is the raw material that fuels these revenue projections, representing a form of "data exploitation."
- Competition and Monopoly: The competitive dynamic shown (OpenAI and Anthropic) could ultimately lead to monopolization, with a single entity controlling a significant portion of the AI market, exacerbating the power imbalance.
Postmodernism
Postmodernism would approach this chart with a degree of skepticism towards its 'truth' claims.
- Simulacra & Simulation: The revenue projections are, in a sense, simulacra – representations that have become detached from any real underlying reality. They are based on models and assumptions, rather than concrete facts. The chart is a simulation of a future that may or may not materialize.
- Deconstruction of Grand Narratives: The chart participates in the “grand narrative” of technological progress and economic growth. A postmodern critique would deconstruct this narrative, highlighting its inherent biases, exclusions, and power dynamics.
- Relativism: The footnote about varying estimates ("consensus remains uncertain") hints at the inherent relativity of these projections. There's no objective truth here, only different interpretations and perspectives.
- The Death of the Author/Intent: The creators of this chart aren't simply presenting "objective" information; they have a vested interest in promoting a particular narrative (attracting investment, legitimizing the AI field). The "author" (in this case, the organization producing the chart) is not a neutral observer.
Queer Feminist Intersectional Analysis
This one is a bit more subtle, but still relevant.
- Bias in Data & Algorithms: The chart doesn't explicitly address the problem of bias in AI, but the underlying technologies driving these projections are often trained on datasets that reflect and perpetuate existing social inequalities (gender, race, class, etc.). These biases can impact the outcomes and applications of AI, reinforcing discriminatory practices. The projected revenue ignores the social costs of those biases.
- Gendered/Racialized Labor: The labor involved in training and maintaining AI systems is often undervalued and disproportionately performed by marginalized groups. The economic benefits are not equitably distributed.
- Exclusionary Innovation: The focus on maximizing revenue may lead to AI applications that prioritize the needs of dominant groups, while neglecting the needs of marginalized communities. Innovation becomes exclusionary, reinforcing existing power structures.
- The "Rational" Actor Myth: The assumption that economic rationality is the primary driver of AI development ignores the impact of social and cultural factors, including gendered and racialized norms.
In conclusion, this seemingly straightforward chart is laden with ideological implications. While it presents a picture of economic promise, a critical reading reveals how it reinforces existing power structures, commodifies intelligence, and potentially exacerbates social inequalities. It's a potent symbol of the complex and often contradictory forces shaping the future of Artificial Intelligence.
simple-description (llama3.2-vision_11b)
The meme is a graph that compares the projected annual revenue of OpenAI and Anthropic, two AI companies. The graph shows that OpenAI is expected to generate $100 billion in annual revenue by 2025, while Anthropic is expected to generate $70 billion in annual revenue by 2028. The meme is meant to be humorous, as it suggests that OpenAI is expected to generate more than 3.5 times more revenue than Anthropic, which is a significant difference.
The text in the image reads: "OpenAI & Anthropic's projected annual revenue: $100B vs. $70B. That's 3.5x. That's a lot of money."