First Seen
2026-03-09T04:17:13+00:00
simple-description (qwen3.5_2b-q8_0)
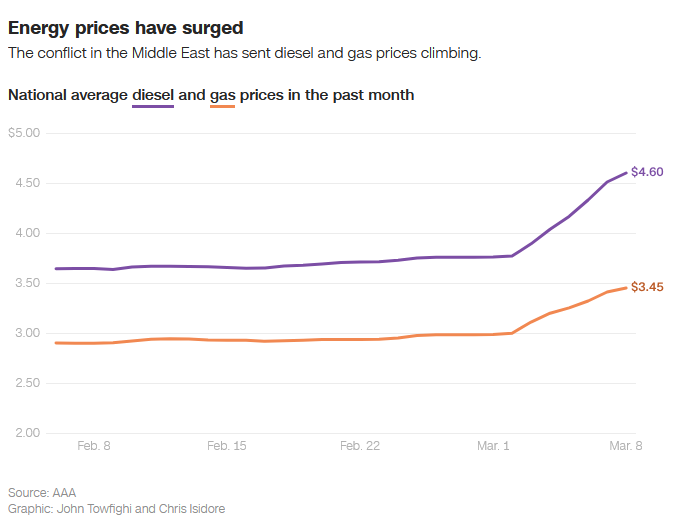
The image displays a line graph titled "National average diesel and gas prices in the past month," showing two distinct lines tracking energy costs from February 8 to March 8. One line (purple) rises sharply from approximately $3.65 to $4.60, while the other line (orange) remains much flatter, staying just above $2.90 and ending around $3.45.
This graph is commonly used in political satire for an "Anti-Trump" context. It visually represents the difficulty of keeping energy costs low by comparing Trump's original price standards set back in February (around $3.70) to current reality, which has surged over 20% by March. The meme suggests that while Trump had a standard or policy price point earlier this year, the current cost is now nearly tripled, making it impossible for him to maintain previous affordability or commitments without significant economic changes.
detailed-analysis (gemma3_27b-it-q8_0)
Okay, let's break down this graphic from an anti-Trump perspective, utilizing the requested theoretical frameworks where applicable.
Overall Context: This graphic visually demonstrates a steep rise in diesel and gasoline prices coinciding with recent escalations in the Middle East, and is framed as a direct consequence of that escalation. From an anti-Trump lens, this is likely presented to highlight a perceived failure of Trump's foreign policy (or a continuation of his approach by the current administration, depending on the timing of the post) and a critique of the inherent instability fueled by US intervention in the region. It also functions as a reminder of how events abroad directly impact working-class Americans’ wallets. The meme aims to connect global events to domestic economic realities, aiming to build a narrative of responsibility.
---
Visual Description
The graphic is a simple line graph showing the national average prices for diesel (purple line) and gasoline (orange line) over the period from February 8th to March 8th. The Y-axis measures prices in dollars, ranging from $2.00 to $5.00. The X-axis represents the dates. The diesel price starts around $3.50 and rises sharply toward the end of the period to $4.60. The gasoline price starts around $2.90, and rises more moderately to $3.45. The title states “Energy prices have surged” and links this surge to “The conflict in the Middle East”. The source is cited as AAA, lending a veneer of objective data.
---
Foucauldian Genealogical Discourse Analysis
A Foucauldian analysis would examine the discourse surrounding energy prices and the Middle East, and how this graphic participates in that discourse. The statement linking price surges to the conflict isn't a neutral observation; it constructs a relationship between them.
- Power/Knowledge: The AAA, as a source, holds a certain authority. Presenting this data with the explicit link to the Middle East performs an act of knowledge, framing the situation in a specific way. This is not just reporting the facts but enacting a power dynamic by defining the cause-and-effect relationship.
- Genealogy of “Crisis”: The idea of an “energy crisis” is not new. A genealogical approach would trace the historical evolution of this concept. During the Trump era (and before), the narrative of energy independence was strong. This graphic implicitly contrasts that narrative with the reality of global interdependence and susceptibility to geopolitical events. The anti-Trump sentiment would highlight how Trump’s policies (whether withdrawing from international agreements, supporting certain regimes, or aggressive rhetoric) may have sown the seeds for this current vulnerability.
- Disciplinary Power: The graphic operates as a subtle disciplinary power, reinforcing the idea that events in distant lands have a direct and unavoidable impact on everyday life (the cost of fuel). This creates a sense of helplessness and reinforces the need for political intervention.
---
Marxist Conflict Theory
From a Marxist perspective, this graphic is a clear illustration of the contradictions inherent in capitalism.
- Exploitation and Resource Control: The Middle East is a region deeply entangled with the global capitalist system through oil and gas resources. The "conflict" itself (the cause of the price surge) can be seen as a struggle for control over these resources and the profits they generate.
- Class Warfare: Rising fuel prices disproportionately affect the working class. They represent an increased cost of living, reducing disposable income and exacerbating economic inequality. The graphic, from an anti-Trump position, would emphasize that this is a result of a system that prioritizes profit (for oil companies and the ruling class) over the needs of the majority.
- Imperialism: US intervention in the Middle East has historically been driven by economic interests—specifically, access to oil. The graphic implicitly critiques this history of imperialism, suggesting that the current crisis is a direct consequence of these interventions.
- False Consciousness: Anti-Trump proponents would argue that the ruling class attempt to deflect blame for price increases (e.g., onto foreign conflicts) to obscure the underlying systemic causes. The graphic is a tool to pierce this "false consciousness" and reveal the true drivers of economic hardship.
---
Postmodernism
A postmodern reading would focus on the deconstruction of the narrative presented.
- The "Truth" of Causation: The graphic asserts a causal relationship between the Middle East conflict and price increases. Postmodernism would question this simple linear relationship. There are numerous other factors at play (supply chain issues, refining capacity, speculation, etc.). The graphic’s framing presents a singular, totalizing explanation that ignores nuance.
- The Role of Representation: The graphic itself is a representation of reality. It’s not reality itself. The choice to highlight this specific timeframe and correlation is a rhetorical choice, designed to persuade the viewer.
- Simulacra & Simulation: The link between the conflict and rising prices may be less about a concrete cause-and-effect and more about a simulation of cause and effect – a narrative constructed to reinforce existing anxieties and political narratives.
---
Queer Feminist Intersectional Analysis (Less Directly Applicable, but Possible)
While less central, an intersectional approach can add layers to the analysis.
- Disproportionate Impact: Rising fuel prices affect vulnerable communities (low-income individuals, people of color, rural populations, single-parent households) disproportionately. A queer feminist perspective would also examine how these rising costs might intersect with other forms of discrimination and marginalization, impacting access to resources and care for LGBTQ+ individuals and women.
- Care Work and Mobility: Increases in transportation costs impact access to essential services like healthcare, childcare, and work, disproportionately burdening those who perform unpaid care work (often women).
- Environmental Justice: This situation can be linked to broader issues of environmental justice. The reliance on fossil fuels, the conflicts surrounding their extraction, and the resulting price increases all contribute to environmental degradation that disproportionately impacts marginalized communities.
---
In conclusion: From an anti-Trump perspective, this graphic isn’t just a data point; it’s a political statement. It’s a visual argument that implicates past (and potentially present) policies in creating economic instability and exacerbating hardship for everyday Americans. It leverages the anxieties surrounding global events to build a narrative of responsibility and critique the underlying structures of power. The theoretical frameworks provide tools for unpacking the multiple layers of meaning embedded within the seemingly simple presentation of rising fuel prices.
simple-description (llama3.2-vision_11b)
The meme is a graph showing the rising prices of diesel and gas in the United States, with a focus on the increasing cost of fuel. The text "Energy prices have surged" is at the top of the graph, highlighting the trend of rising prices. The meme is likely being used to criticize or comment on the current state of the economy, possibly in relation to the anti- Trump movement.