First Seen
2026-02-10T04:56:33+00:00
detailed-analysis (gemma3_27b-it-q8_0)
Okay, let's break down this chart – "The Dominance of Google and Facebook" – through the lenses requested. This is a complex task, as applying these theoretical frameworks to a data visualization requires some interpretive leaps and isn't always a perfect fit. I'll focus on where each framework offers the most insight, and be explicit when a framework isn’t particularly helpful.
Visual Description
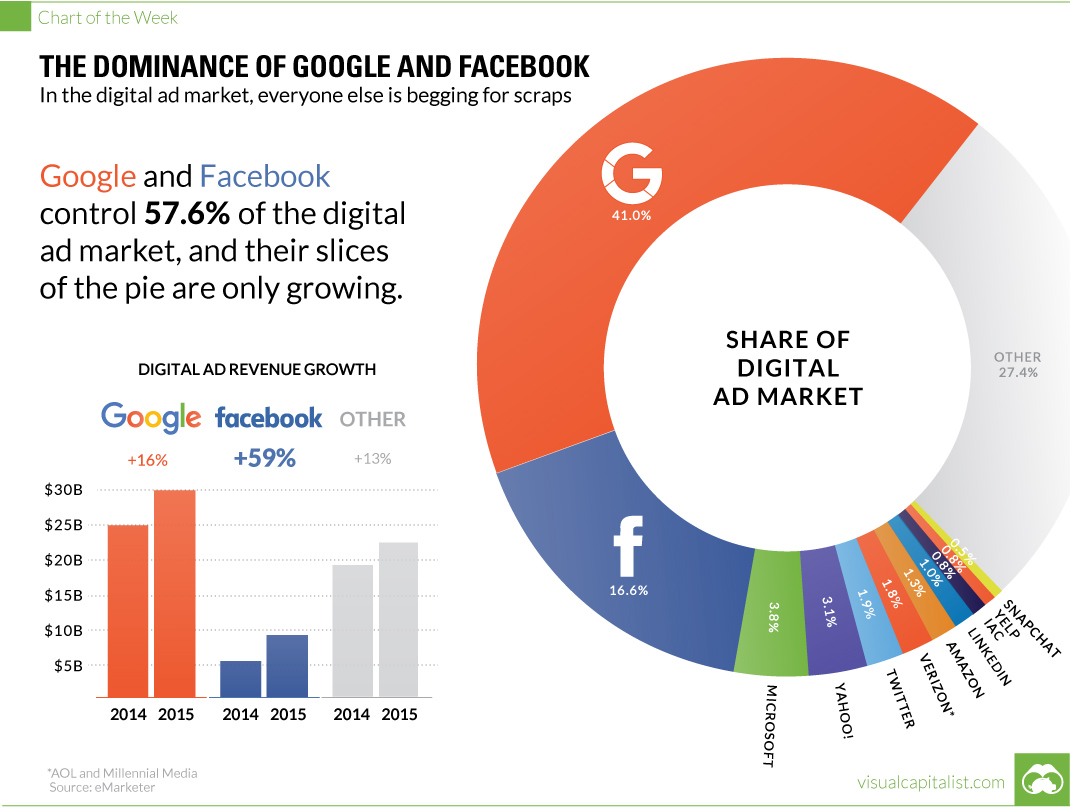
The chart visually represents the share of the digital advertising market. The dominant feature is a large, segmented pie chart with Google occupying 41.0% of the market, and Facebook at 16.6%. A very significant portion (27.4%) is categorized as “Other,” but it’s fragmented into small slices representing individual companies like Microsoft, Yahoo, Twitter, Verizon, Amazon, LinkedIn, IAC, Yelp, Snapchat.
Beside the pie chart is a bar graph illustrating digital ad revenue growth between 2014 and 2015. Google shows significant growth (+16%), followed by Facebook (+59%), with the "Other" category only experiencing +13%. This growth trend reinforces the narrative of a widening gap between the two dominant players and the rest of the market. The color scheme is impactful: Google is a vibrant orange, Facebook is blue, while “Other” is a more muted, divided palette, emphasizing fragmentation. The slogan “everyone else is begging for scraps” is a particularly harsh framing.
---
Foucauldian Genealogical Discourse Analysis
This chart provides a powerful illustration of how knowledge and power are intertwined in the digital advertising landscape. Michel Foucault's genealogical method would focus on the historical development of the categories represented here.
Discourse of ‘Growth’ & ‘Dominance’: The very terms* used – “growth”, “dominance”, “share” – construct a discourse. They normalize a hierarchical structure where growth is measured as market share, and dominance is presented as a positive outcome. This isn’t a neutral description; it establishes a power dynamic.
The Creation of ‘The Other’: The grouping of all other competitors into "Other" is crucial. It functions as a negative definition - everything that isn’t Google or Facebook is relegated to a less significant, fragmented space. This isn't just about numbers; it creates* a category of marginality.
Technologies of Power: The algorithms, data collection practices, and advertising platforms developed by Google and Facebook are not merely tools, but technologies of power*. They allow these companies to monitor, categorize, and influence consumer behavior, solidifying their control over the advertising market. The chart is a symptom of these technologies at work, showcasing their effects.
* Genealogy of Ad Tech: Tracing the historical trajectory of ad tech would reveal how practices like behavioral targeting, real-time bidding, and programmatic advertising – initially presented as innovations – have contributed to the centralization of power in the hands of Google and Facebook. This power isn't intentional in a conscious way but emerges organically from the nature of the systems themselves.
---
Critical Theory
From a Critical Theory perspective (drawing from the Frankfurt School, particularly Adorno and Horkheimer), the chart is a sign of the “culture industry” at work.
* Standardization and Homogenization: The dominance of Google and Facebook represents the standardization and homogenization of advertising. They exert control over the platforms through which information is disseminated, limiting diversity of expression and critical thought.
Pseudo-Individualization: Advertising, even targeted advertising, isn't truly about individual needs. Instead, it creates pseudo-individualization* – the illusion of personalization that reinforces the existing capitalist system. Google and Facebook’s data collection practices contribute to this process, reducing individuals to data points for profit.
* Ideological Control: The chart reveals how advertising is not merely a commercial activity but a key mechanism for ideological control. The message isn't just to buy products; it's to accept a world where these two corporations wield immense power.
* Commodification of Attention: Attention itself is becoming a commodity. Google and Facebook are masters at capturing and monetizing attention, further entrenching their dominance.
---
Marxist Conflict Theory
A Marxist analysis would frame this chart as a manifestation of the inherent contradictions of capitalism.
* Concentration of Capital: The chart illustrates the tendency of capital to concentrate in the hands of a few. Google and Facebook represent the culmination of this process within the digital advertising sector.
* Exploitation of Data: Data is the new “labor” in this economy. Google and Facebook exploit user data, extracting value from it without adequately compensating the individuals who generate it. This is a form of surplus value extraction.
* Class Struggle: There's an inherent class struggle at play here. The owners and shareholders of Google and Facebook benefit from their dominance, while smaller competitors and individual users are disadvantaged. The "Other" category represents the fragmented, powerless forces attempting to compete.
* Monopoly Capitalism: The situation moves toward a monopoly capitalist structure, where competition is stifled and a small number of firms control the vast majority of the market.
---
Postmodernism
Postmodernism is a trickier fit, as it often questions grand narratives and stable meanings. However, we can see aspects of it here:
* Deconstruction of 'Market': The concept of a "market" is itself a construct. Postmodernism would challenge the idea that a "free market" leads to optimal outcomes. The chart shows a market profoundly shaped by the power of two corporations, contradicting the notion of a level playing field.
* Simulation and Hyperreality: Advertising creates a simulation of reality, a hyperreality where images and desires are detached from material existence. Google and Facebook, as gatekeepers of this simulation, wield immense power.
* Fragmentation and Plurality: While Google and Facebook dominate, the “Other” category represents a degree of fragmentation and plurality. However, this fragmentation is largely symbolic, as these smaller players have limited influence. The chart demonstrates a kind of "simulacrum of competition."
* Loss of Authenticity: Advertising, particularly when mediated by algorithms, contributes to a loss of authenticity. The chart suggests a system where genuine connection and value are replaced by data-driven targeting and manipulation.
---
Queer Feminist Intersectional Analysis
This framework is perhaps the least directly applicable, but still offers some relevant insights.
* Power Imbalances & Visibility: The chart highlights existing power imbalances. The dominance of Google and Facebook is not neutral; it reflects broader societal inequalities. Considering the demographic make-up of these companies, as well as the biases embedded in their algorithms, reveals how certain groups are systematically marginalized.
* Data Privacy & Surveillance: Data collection practices disproportionately impact marginalized communities. Concerns about surveillance, data privacy, and algorithmic bias are particularly acute for groups already vulnerable to discrimination.
* Commodification of Identity: Advertising can commodify identity, reinforcing harmful stereotypes and norms. Google and Facebook's targeted advertising can exacerbate these issues by presenting narrowly defined representations of identity.
* Intersectionality of Power: The dominance is not solely about market share. It intersects with power structures based on race, class, gender, and sexuality. The algorithms used by these companies can perpetuate and amplify existing biases, creating unequal outcomes.
In conclusion, this chart, at first glance a simple representation of market share, opens up a wealth of analytical possibilities when viewed through the lens of these critical theoretical frameworks. It illustrates the concentration of power, the dynamics of exploitation, and the broader cultural and ideological implications of the digital advertising economy.
simple-description (llama3.2-vision_11b)
The meme is a chart showing the share of the digital ad market for various companies. It appears to be a pie chart with a large "G" slice representing Google's 41% share of the market, with a smaller "F" slice representing Facebook's 16.6% share. The chart's title, "The Dominance of Google and Facebook," is a play on the phrase "the dominance of [insert company name]" to highlight the companies' market share.